Tracking Goods Exports under the Trump Administration's Trade Policies: The Latest Data
Back in May, I posted about how U.S. goods exports were doing under Trump's trade policies. In this post, I'm going to provide an update based on 3 additional months of data, with export data for January - June now covered for the years 2023 - 2026.
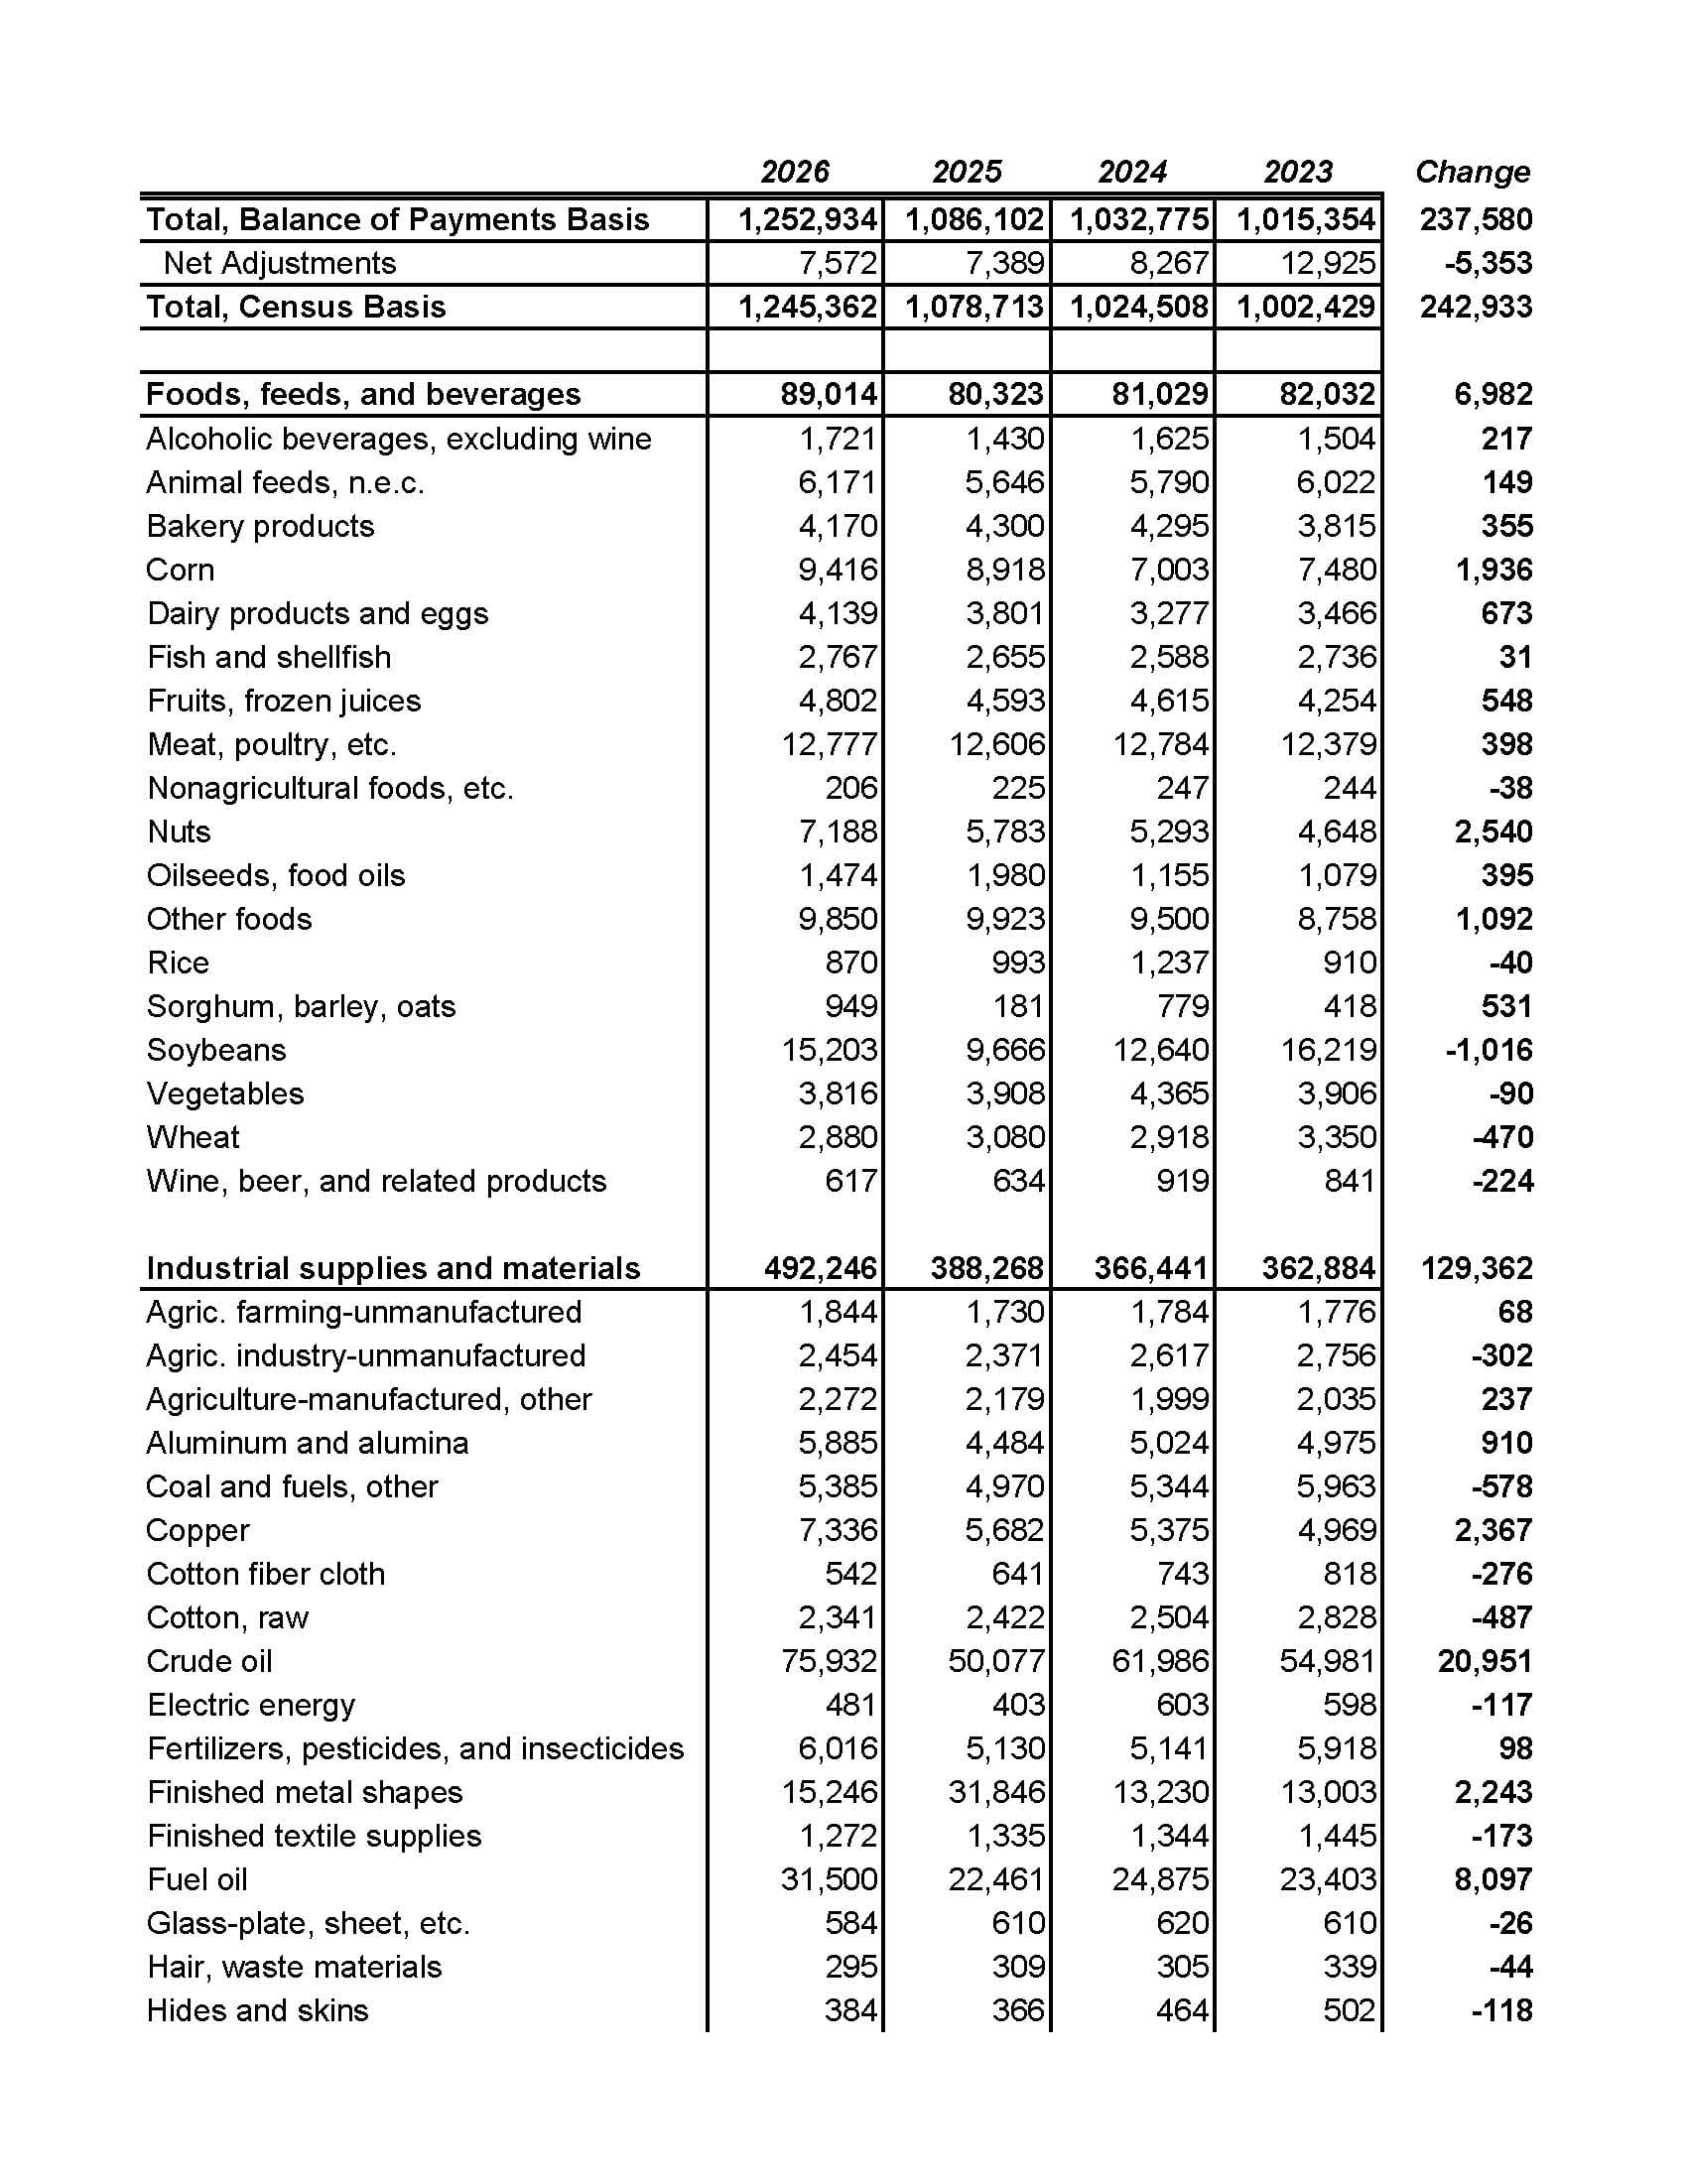
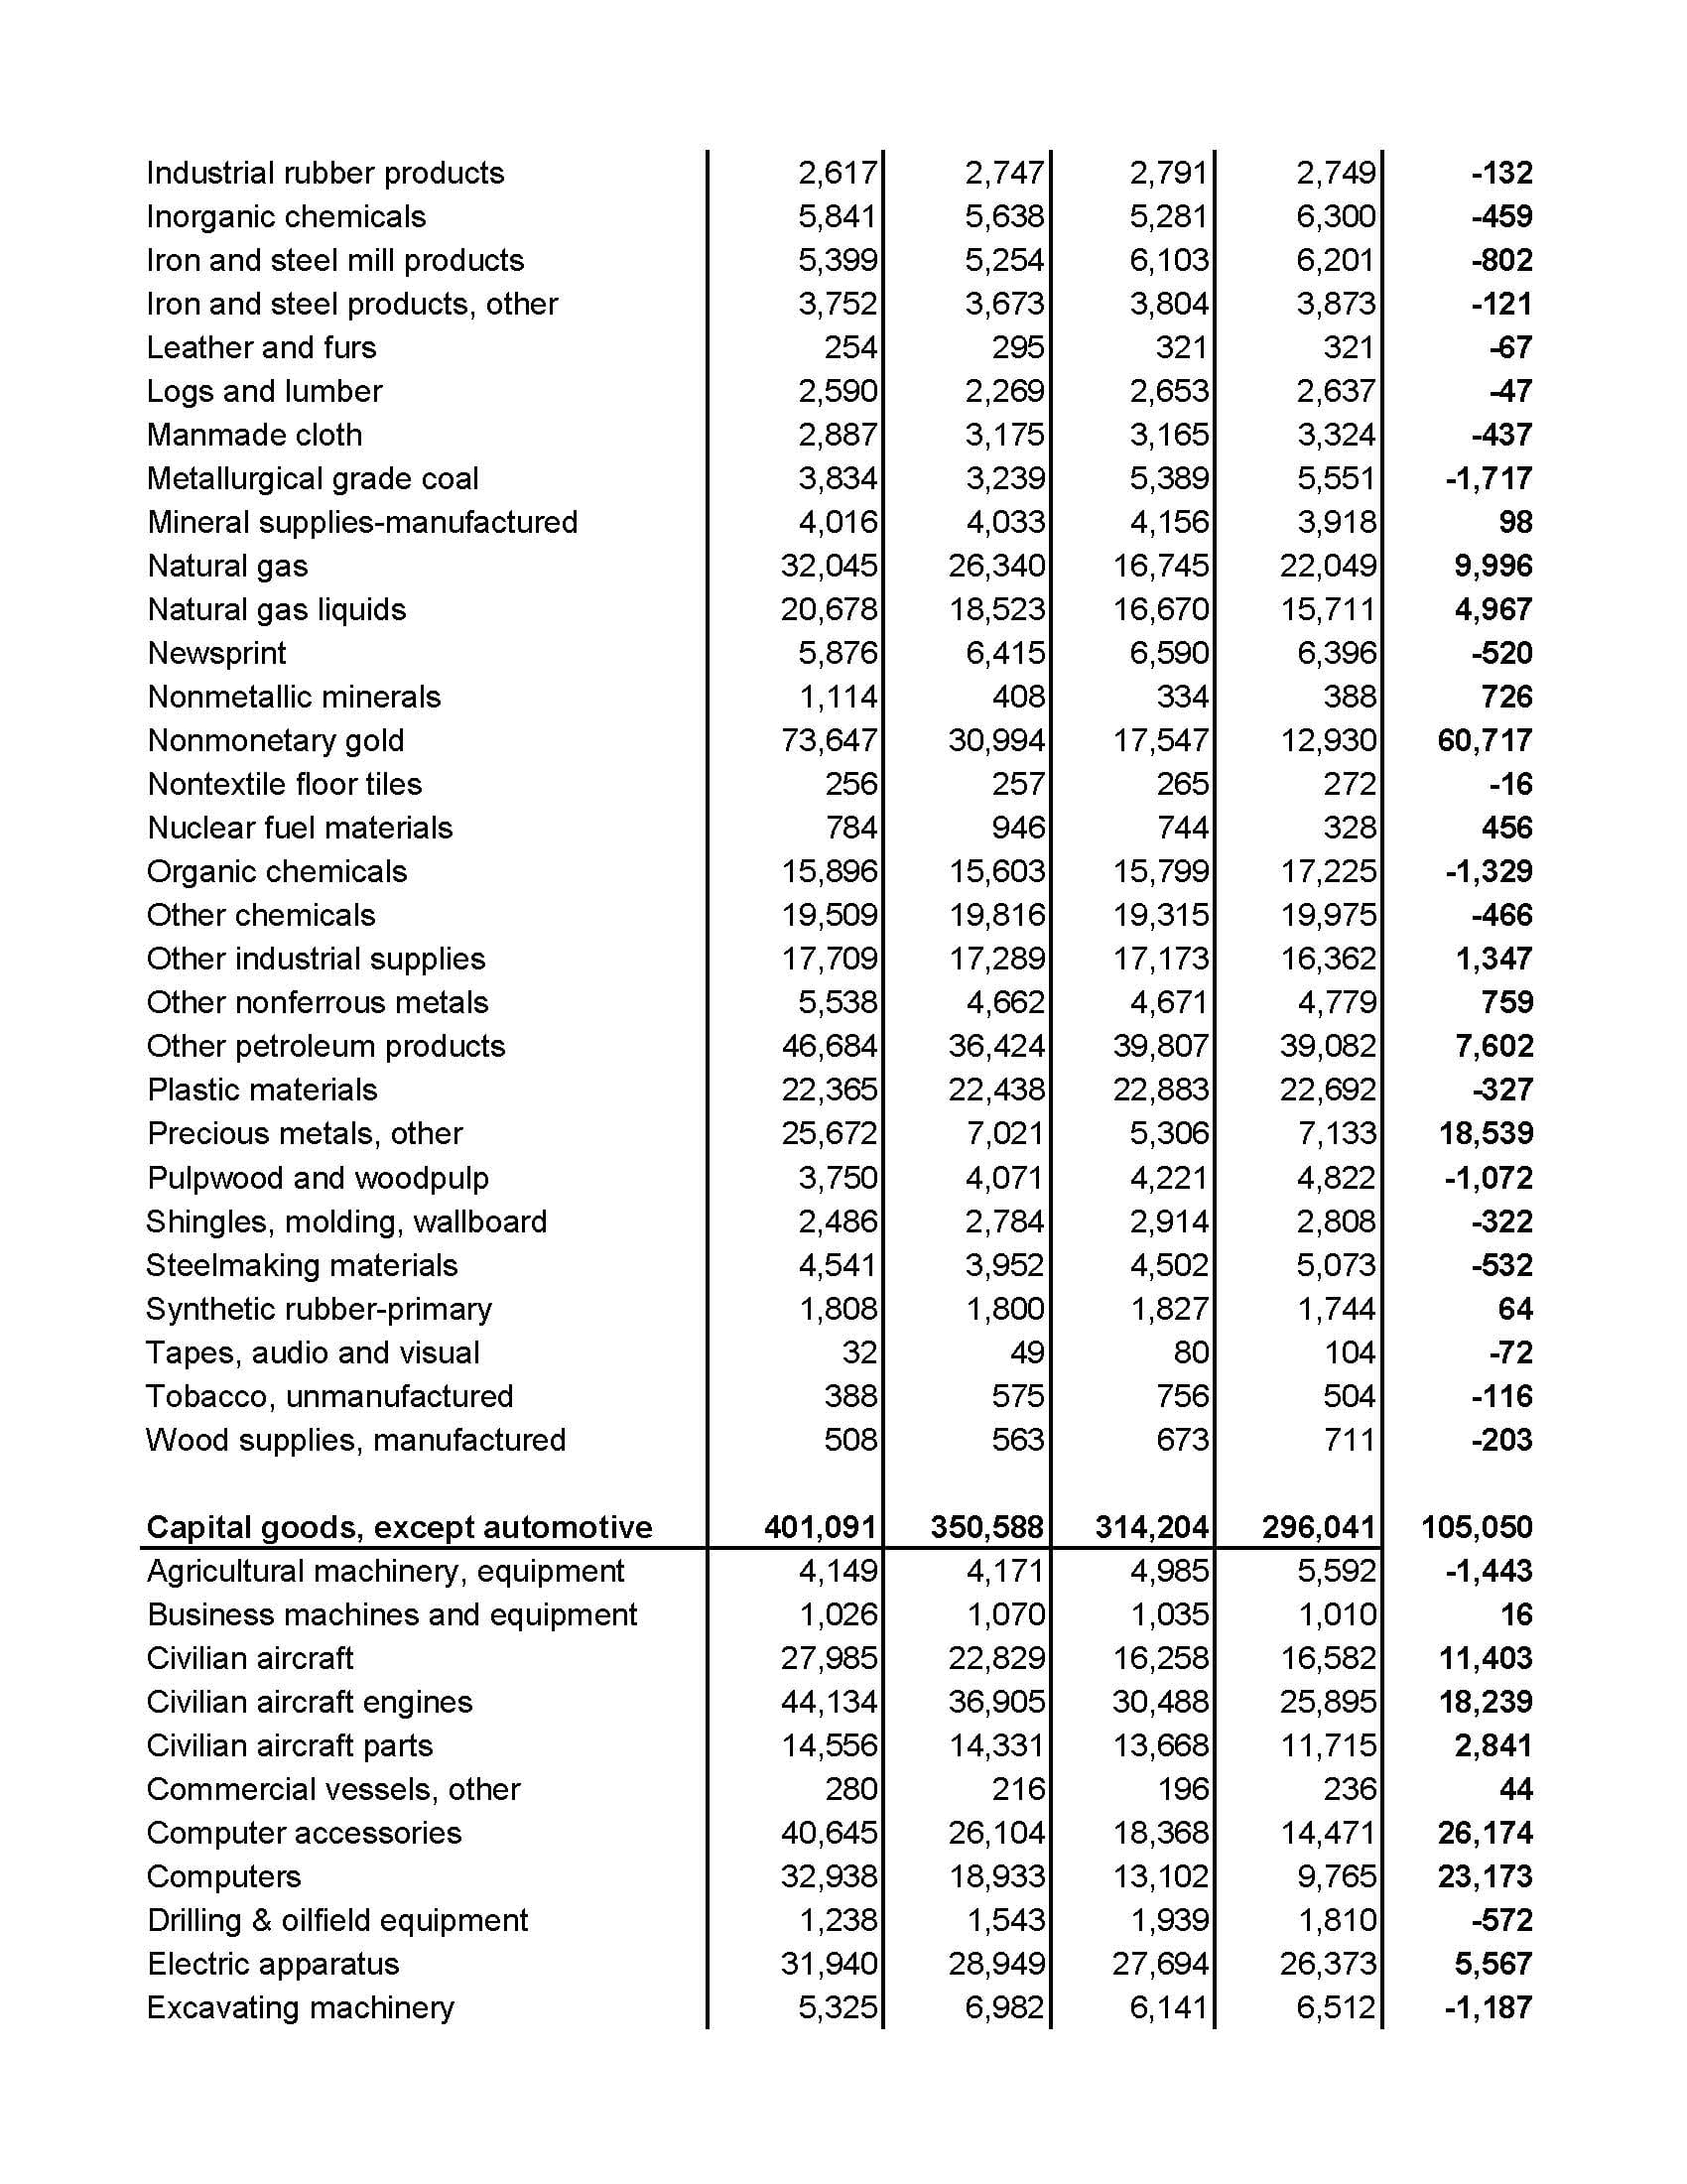
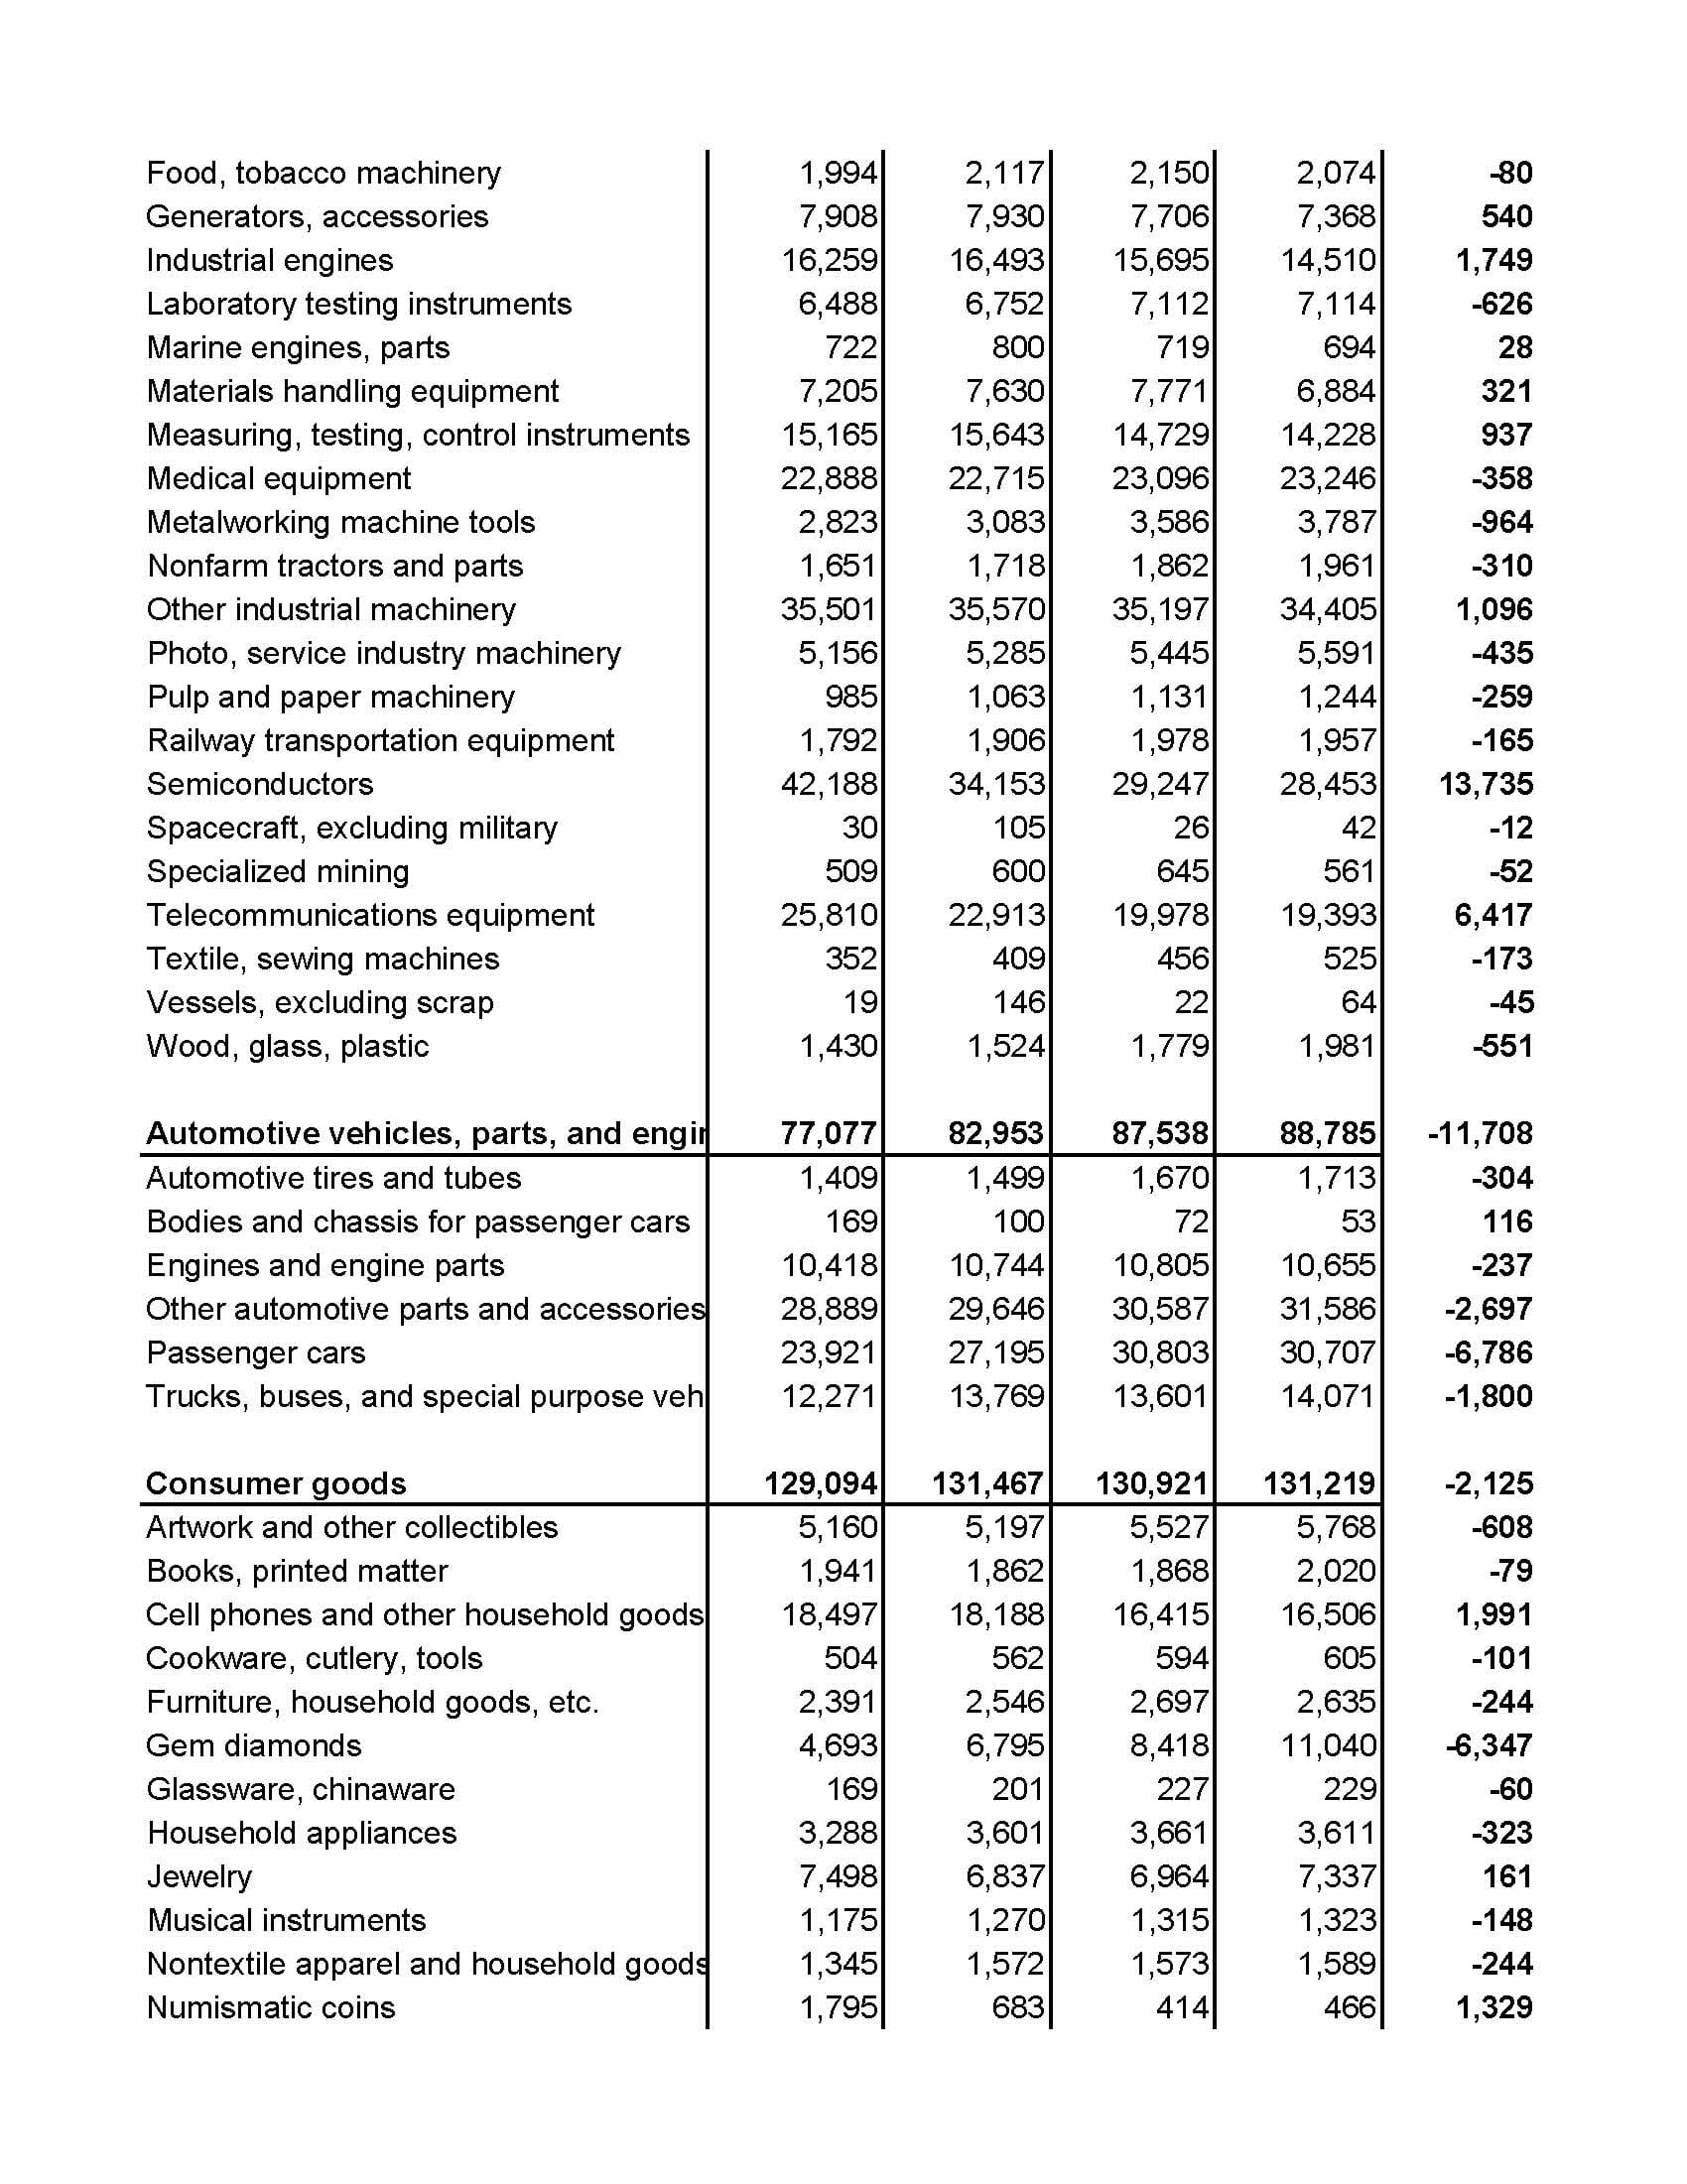
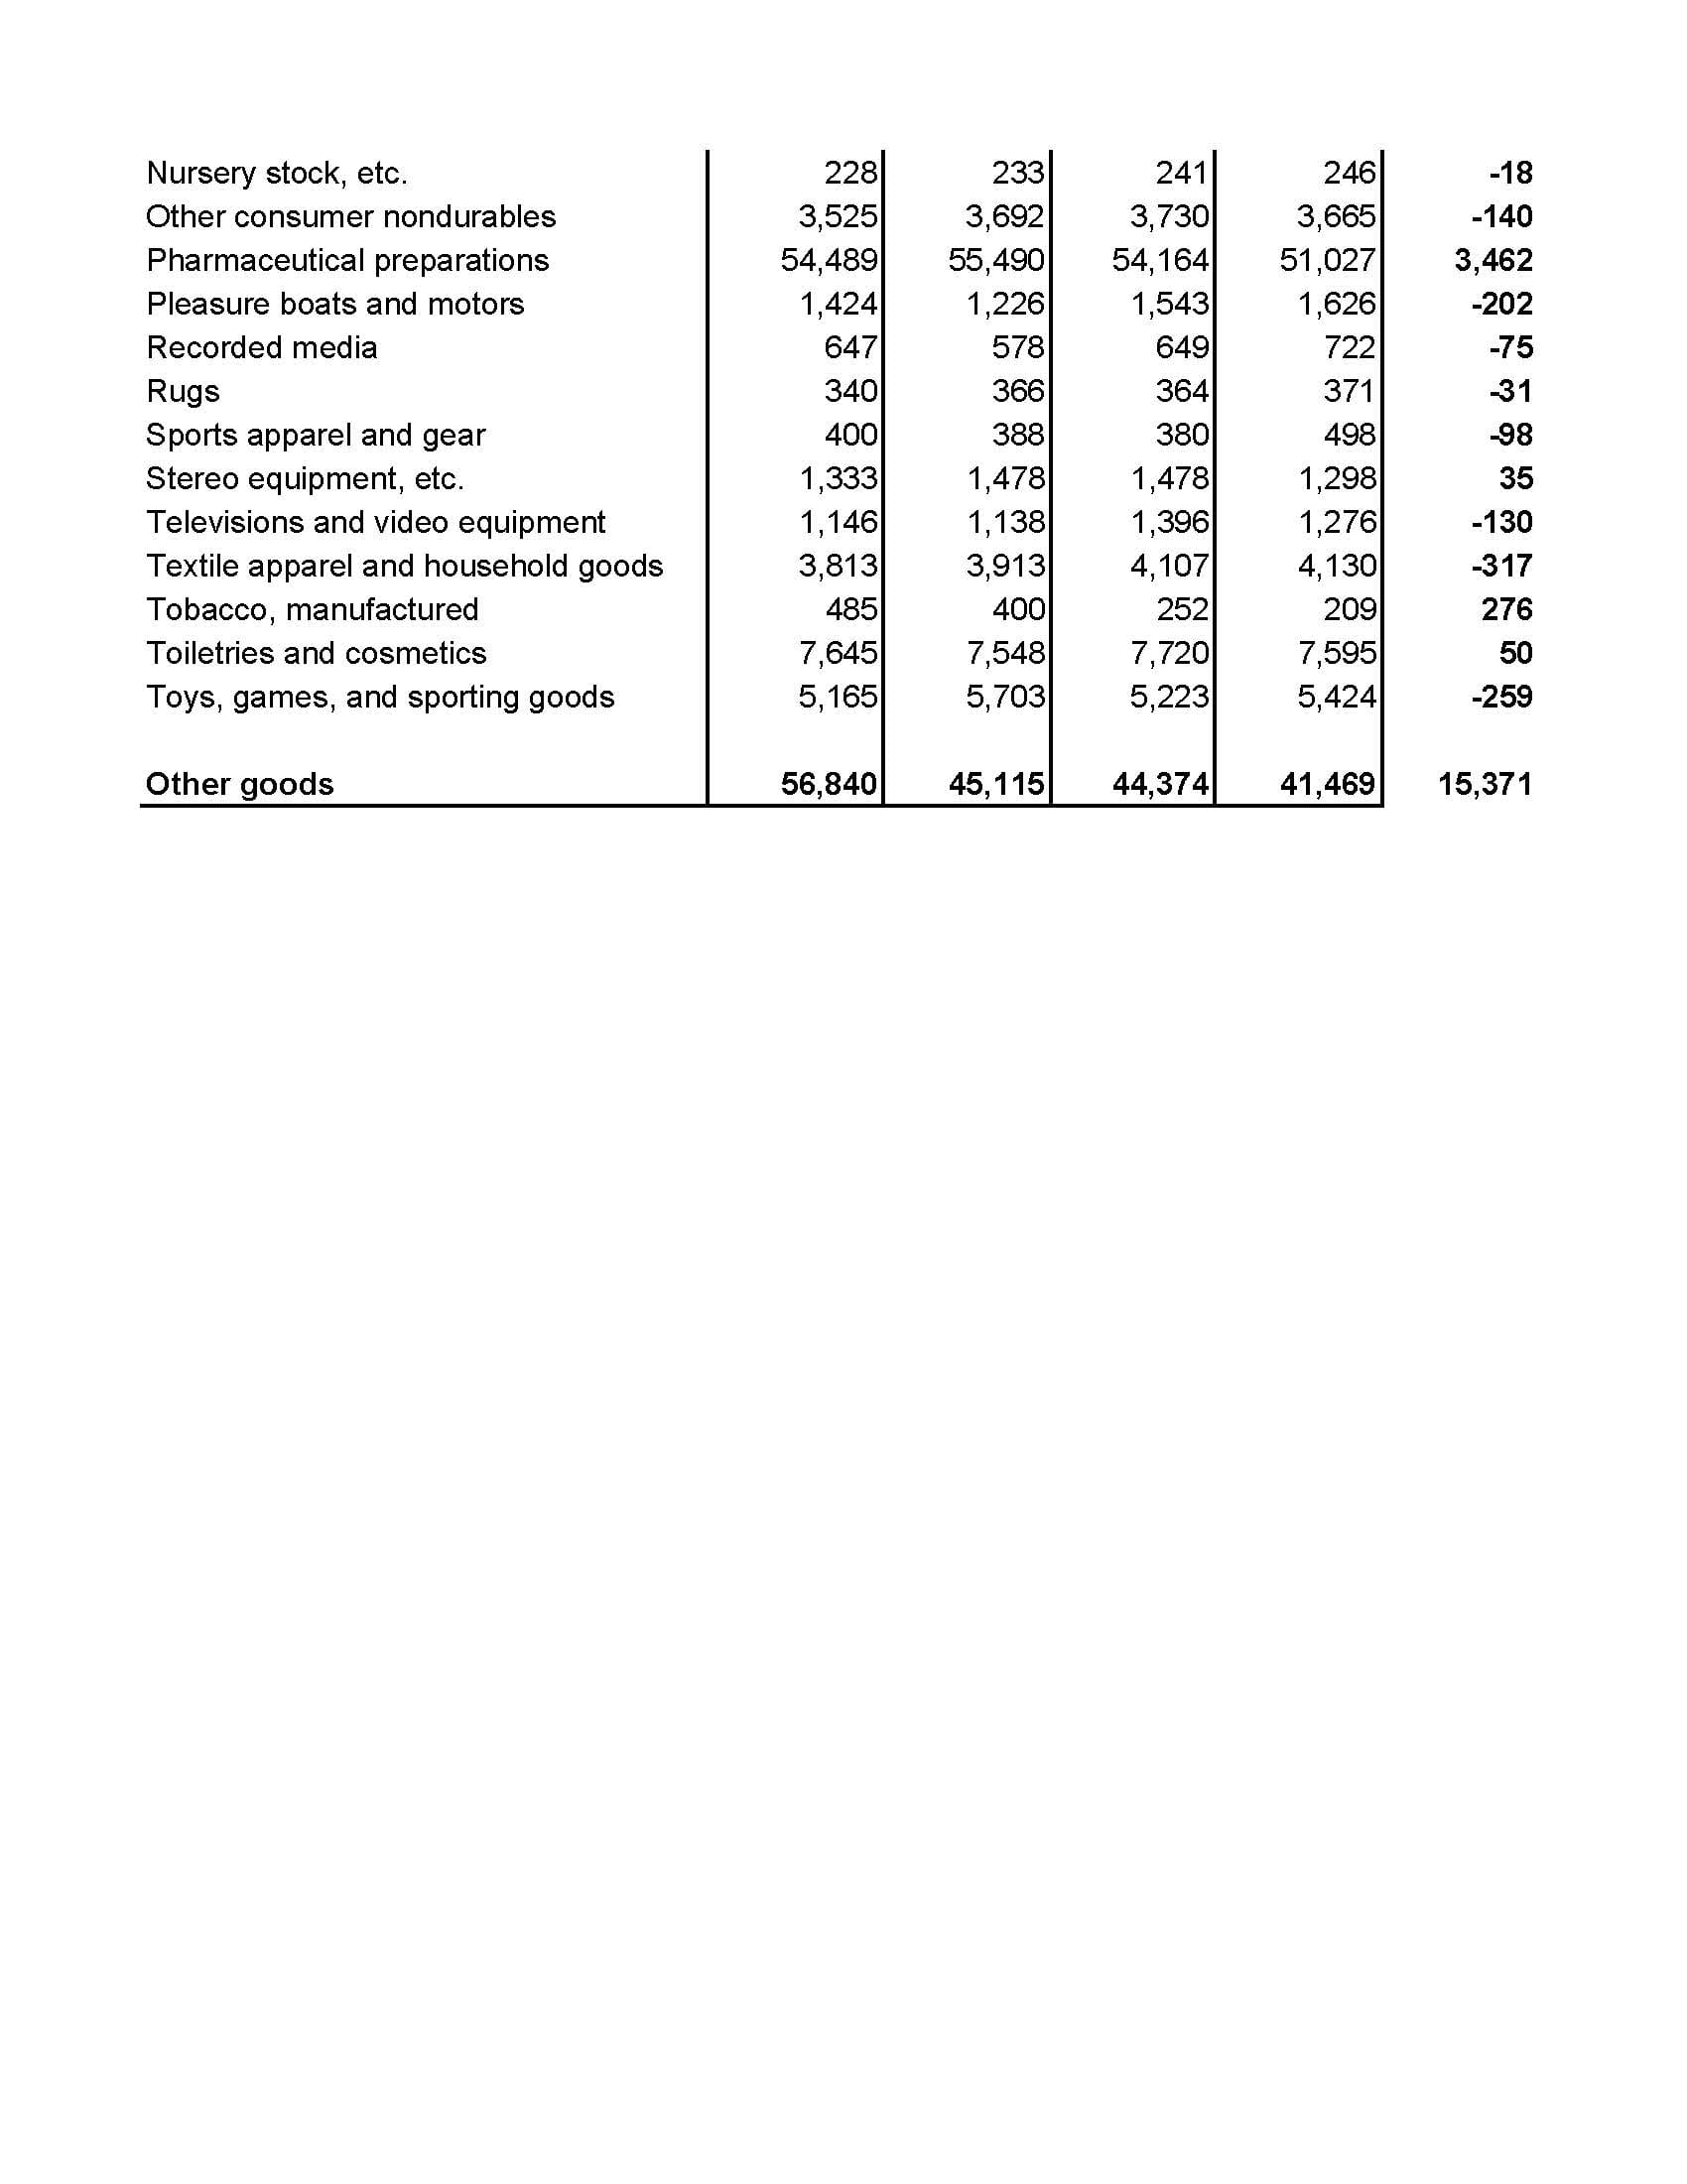
The data provided in monthly BEA trade data releases only goes back two years, so to get a four year comparison, I took the releases for June 2026 and June 2024 and then integrated the data from Exhibit 7: U.S. Exports of Goods by End-Use Category and Commodity in each release to create the table at the bottom of this post – scroll down to see it. An Excel spreadsheet I created with the data is here.
Note that the figures are nominal rather than inflation-adjusted. Given the relatively high levels of inflation in recent years, I should probably adjust them to give a clearer picture of things, but I was feeling a bit lazy (and formatting the table to display it here was a pain and took some time!). So take that into account. Next time I come back to this I'll do the adjustment.
Here are the highlights of what I see:
- Agriculture exports are up slightly, with corn and nuts accounting for most of the increase, and soybeans now almost back to 2023 levels. (China has stepped up its soybean purchases, so that might explain things there. On corn, an article from March says Japan, South Korea, Mexico, Taiwan, and Spain are responsible for most of the increase in corn exports. U.S. corn production was up a lot in 2025, so maybe that's part of the explanation for this one.)
- Industrial supply exports are up, but that is mostly due to oil/natural gas (presumably because of higher prices) and non-monetary gold (which, as I noted in my earlier post, seems to mainly be about people looking for safe investment assets).
- Capital goods exports are up, with aircraft/engines and computers/semiconductors driving the numbers. The latter may be due to the general AI infrastructure boom.
- Automobile exports are continuing their downward trend.
- Consumer goods are also down slightly.
- "Other goods" are up but I don't have a sense of what this is about.
Here's the table (which is broken up into multiple images because I couldn't get it all in one image):
U.S. Exports of Goods by End-Use Category and Commodity (in millions of dollars), January - June, by year 2023-2026