How Are U.S. Goods Exports to Canada and Mexico Doing under Trump’s Trade Policies?
This post was written by IELP Blog intern Kiyan Slove-Rezvani
Previous posts on this blog have looked at trends in U.S. exports under the Trump administration’s trade policies, focusing on either specific categories of products or on the top U.S. trade partners. This post combines these two elements, offering a comparison of (1) U.S. goods exports to Canada and Mexico in the first quarter of 2026 with (2) the average of these exports in the first quarters from 2022 to 2024, broken down by product category. The data, drawn from the Census Bureau, looks at both the aggregate exports and individual categories exported to both nations, categorized by HS code.
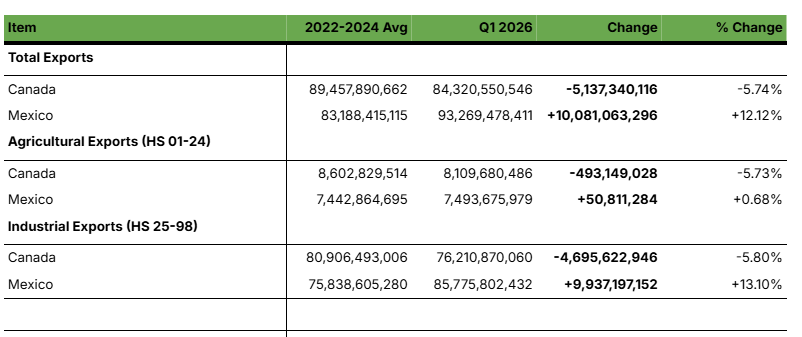
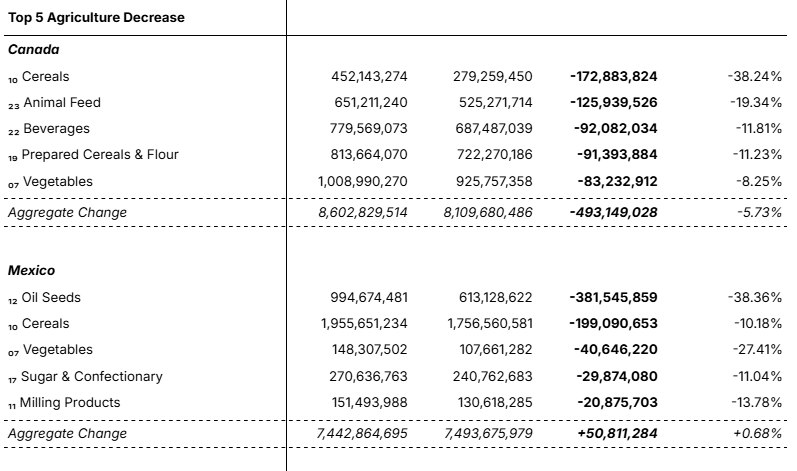
One takeaway from this data is that exports to Canada and Mexico have moved in opposite directions. Canada’s total exports in the first quarter of 2026 fell roughly $5 billion below the 2022-2024 average, a decline of about 5.7%. The story with Mexico is different, though, with first quarter exports in 2026 rising sharply from the 2022-2024 average, about a $10 billion jump (+12.1%). The same trade environment produced two distinct outcomes for our neighboring countries.
The timing is what makes this comparison useful. The 2022-2024 average gives us a baseline before President Trump’s second term trade policy shuffle, while the first quarter of 2026 lands a full year into his term, after the new tariffs (and their many modifications) have taken effect. Comparing the two periods allows us to get a sense of the magnitude of Trump’s policy changes on trading patterns. (All figures in this post are adjusted for inflation into constant 2026 first quarter dollars using the BLS Export Price Index, so the changes reflect real shifts in trade rather than rising prices.)
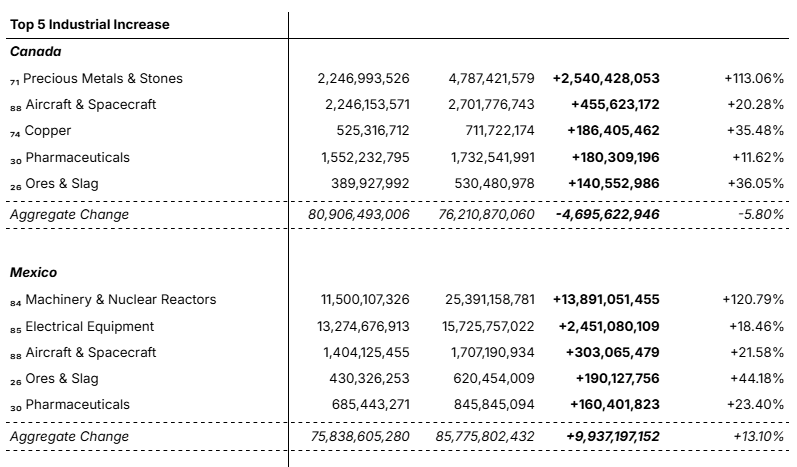
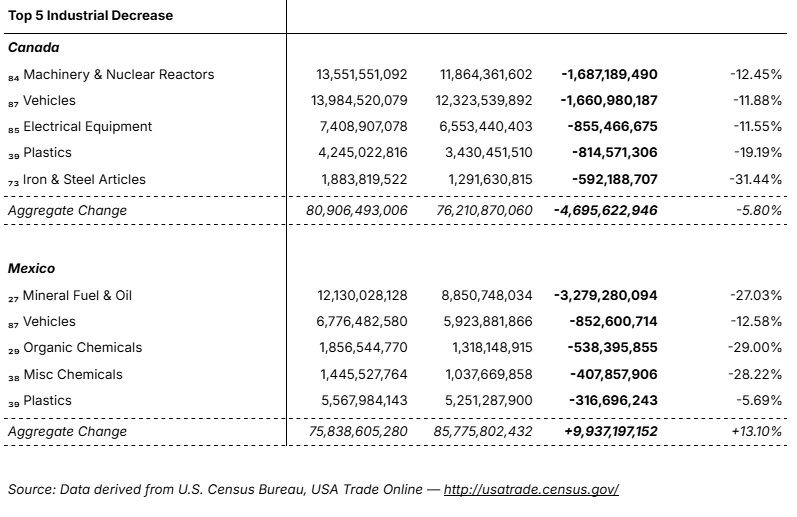
Splitting the data into agriculture and industrial goods sharpens the picture, as industrial goods dwarf agriculture in terms of dollar value, driving the story for both nations. For Canada, both sectors decreased by almost identical margins, with agriculture down 5.7% and industrial goods down 5.8%. Mexico moved in the opposite direction, with agriculture increasing by just 0.7% and industrial goods by 13.1%.
Some of the declines may trace back to Canada's response to U.S. trade policy. Canada placed retaliatory tariffs on a range of American goods in early 2025, and while it rolled most of them back by September, it kept its tariffs on U.S. steel, aluminum, and vehicles in place, which shows up directly in the export numbers below.
A few of the more notable findings include:
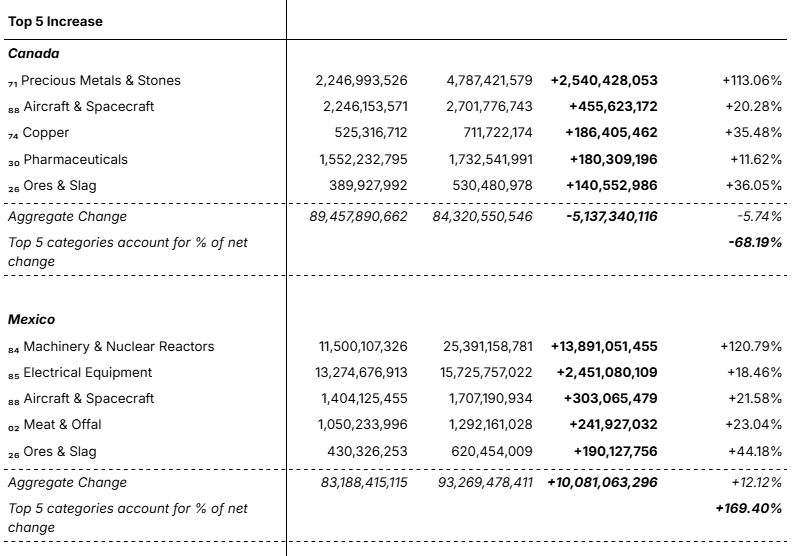
- Machinery exports to Mexico increased sharply (+$13.9 billion, a 121% increase), which could reflect near-shoring, as American companies ship equipment south to build out manufacturing.
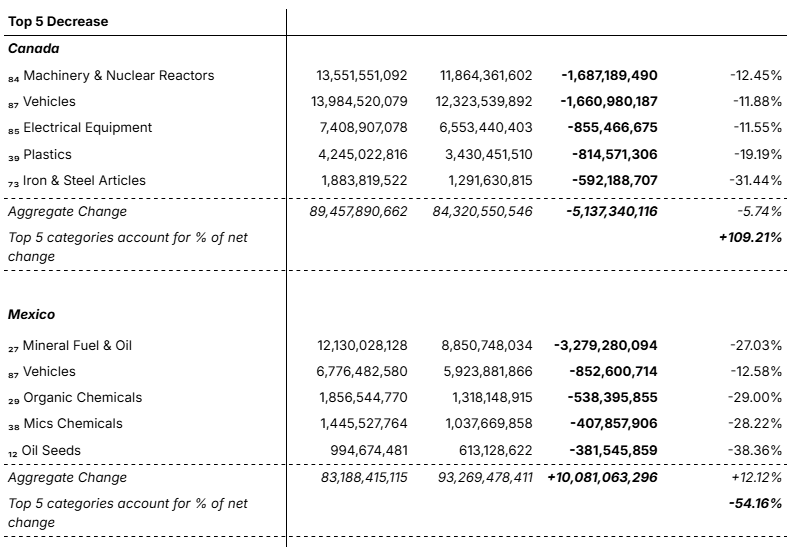
- Iron and steel exports to Canada are down 38%, which likely reflects Canada’s retaliatory tariffs on U.S. steel and aluminum. Canada kept these counter-tariffs in place even after dropping most of its other retaliatory measures in September 2025, so they were still suppressing U.S. steel exports during this period.
- Vehicle exports to Canada are down $1.66 billion (11.9%), which likely reflects Canada’s 25% retaliatory tariffs on U.S. vehicles. Canada imposed this surtax on April 9, 2025 in response to U.S. auto tariffs, and kept it in place even after dropping most of its other counter-tariffs in September 2025.
- Precious metal exports to Canada more than doubled by $2.5 billion (113%), likely the result of the broad surge in gold exports and record gold prices through 2025–2026.
- A $3.28 billion decrease (-27%) of mineral fuel and oil to Mexico as Mexico's Pemex ramped up domestic refining, a shift unrelated to tariffs.
- Liquor exports to Canada fell $92 million (11.8%), one of the categories Canada singled out early in its retaliation and a recent flashpoint in Canada-U.S. trade relations.
It's interesting to note the machinery surge in Mexico, since it is the largest single change in the entire dataset. The most likely explanation is near-shoring, that is, the ongoing shift of manufacturing from Asia into Mexico. As companies build and expand factories they need equipment to fill them, and a large share of that machinery comes from the United States. According to the International Bar Association, thousands of U.S. companies have relocated operations from Asia and Europe to Mexico in recent years, with a Dallas Fed report noting that the benefits to Mexico’s economy began materializing in 2022, particularly in electronics and manufacturing. The scale of this shift shows up in the new investment numbers. New foreign investment into Mexico rose over 200% in the first nine months of 2025, jumping from $2 billion to $6.5 billion, according to Mexico’s Economy Ministry. The United States is the single largest source of that investment, which fits the pattern of American firms building out manufacturing capacity in Mexico and buying U.S. machinery to equip it. In other words, the United States is increasingly selling Mexico the tools it uses to build out its own manufacturing base.
The jump in precious metals points to something happening beyond North American trade policy. Gold prices increased by about 42% in 2025, the largest annual gain since the late 1970s, as investors turned to it as a reliable asset amid a falling dollar and global uncertainty. This caused a dramatic effect on U.S. exports since precious metals usually make up about 4% of U.S. export value, but by February 2026 they had reached 15%, becoming the single largest U.S. export overall. That said, I am hesitant to draw too firm a conclusion here. Much of the gold export activity has been concentrated in countries such as Switzerland and the United Kingdom, which makes Canada’s sharp increase harder to explain.
There is also a slower-moving force worth watching. Canadian travel to the United States dropped sharply over 2025, with car trips down about 31% over the year and overall trips to the U.S. falling roughly 24% in the final quarter, according to Statistics Canada. Canadians also spent about 16% less while in the U.S. during that period. The pullback is tied to a broader "Buy Canadian" sentiment, with polling showing that more than half of Canadians report they plan to cut spending on U.S. goods and travel, according to Bank of Canada. None of this shows up directly in export figures yet, but it points to a cooling of cross-border ties that could weigh on trade well after the current tariffs are settled.
In addition to how the broad rethinking of U.S. trade policy by the Trump administration affects exports, in the Canada/Mexico context there is also the issue of the review of the USMCA. In that context, the administration will be pushing specific market access issues in order to boost exports. Whether those efforts will be successful remains to be seen. The timing for completion of the USMCA review is unclear at this point, but a future look at the export data may be the best judge of what was achieved.
Taken together, the data shows our two neighboring nations responding to the same conditions in completely different ways. Tariffs explain a good portion of the story, especially on the Canadian side, where steel and vehicles fell in line with Canada’s retaliatory tariffs, and where precious metals jumped alongside the global gold rush. But the largest movements in the data were found in Mexico, where the surge in machinery reflects near-shoring and the drop in fuel exports comes from Mexico refining more of its own oil. Tariffs set the backdrop, but are far from the whole picture. It is also worth remembering that the first quarter of 2026 was a moment of transition, which means the next set of numbers could tell a different story altogether.
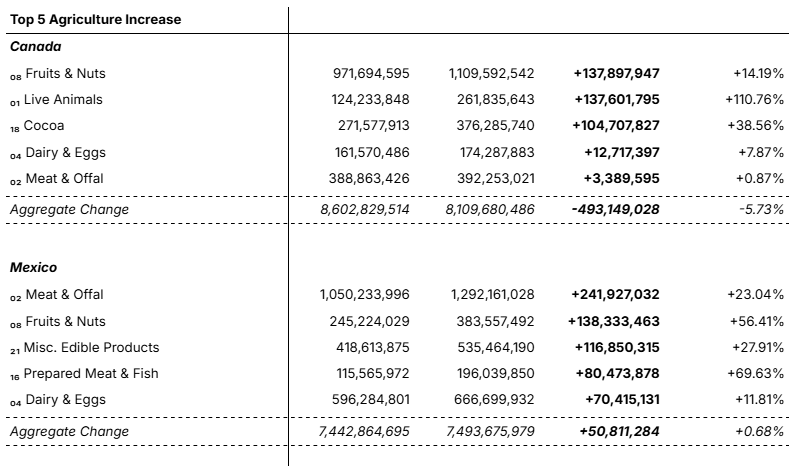
U.S. Exports of Goods to Canada and Mexico by Product Category
January–March, Q1 2026 vs. 2022–2024 Average, adjusted for inflation using the BLS Export Price Index