Tracking Exports under Trump: Country Comparisons
In a previous post, I noted that one of the reasons some traditionally pro-trade members of Congress may be supporting Trump's trade policies, despite misgivings they may have about tariffs, is because they are hoping these aggressive policies will pry open foreign markets and lead to increased U.S. exports of agricultural and other products. For example, Rep. Jason Smith (R-MO), Chairman of the House Ways and Means Committee, has complained that the Biden administration "failed to open new markets for our exports," and in commenting on the Supreme Court's IEEPA ruling said the following: "In just a year, President Trump’s successful America First trade policy has secured massive wins for our farmers, workers and manufacturers in the form of new trade deals with our largest trading partners that unlock unprecedented export opportunities by removing high tariffs and non-tariff barriers to U.S. products."
So how are these export opportunities working out so far? The earlier post focused on exports of specific categories of products, and in this post I'm going to follow up by looking at some Bureau of Economic Analysis (BEA) data on exports broken down by country. In particular, I'll look at overall U.S. goods exports to the top 10 country destinations (which constitutes around 60% of U.S. goods exports).
If you just want to go straight to the export figures, there's a table at the bottom of the post that compares data on January through April goods exports over the period from 2024 - 2026, for each of the top 10 export destinations (note that the data is for value of exports rather than volume, and is in nominal terms, so you would expect the figures to rise a bit during the period to reflect inflation). Some notable points in the data are as follows:
- Exports to Canada are slightly down, which probably in part reflects Canadian consumer attitudes in response to the rhetoric of President Trump and other U.S. government officials
- Exports to China are significantly down, which is likely due in part to Chinese retaliatory tariffs
- Exports to Switzerland are significantly up, which may reflect the non-monetary gold exports that I mentioned in the earlier post
- Exports to Hong Kong are up by about the same amount as exports to China are down, which may reflect transshipment of goods that are ultimately destined for China but which are avoiding the Chinese tariffs (although it could be some non-monetary gold too).
- Exports to the UK are up, and this could be non-monetary gold as well.
To really get into the details of these export patterns, we need to combine the product data with the country data. I'll try to come back to that soon.
Here's the table of export figures by country:
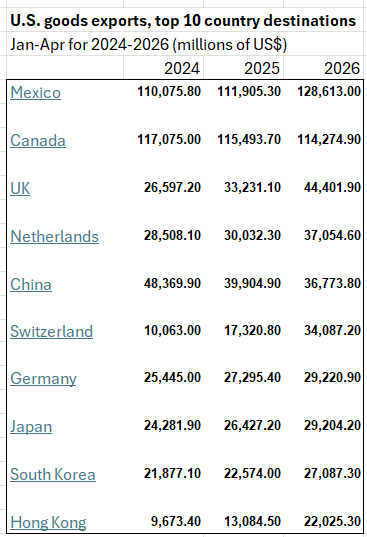
Source: Data derived from Bureau of Economic Analysis trade data